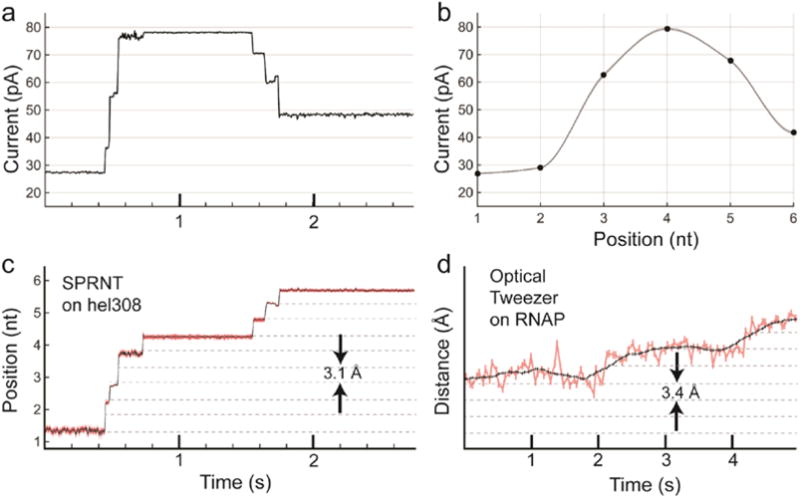
Figure 8. Conversion of current trace to DNA displacement and comparison to OT.

a) Raw current trace from SPRNT measurement of Hel308 helicase median filtered at 200 Hz (5 ms). b) A piecewise cubic hermite interpolating polynomial (PCHIP) interpolation of current values observed for translocation of the same DNA through an MspA pore using phi29 DNAP. c) The interpolation in b) is used to translate the currents observed in a) to DNA position. Note that the relatively uniform noise seen in the current trace is either enhanced or suppressed due to the slope of the interpolant. Regions of high slope yield precise measurements of position on short time-scales while regions of low slope yield less precise position measurements. Nanopore data is displayed at 200 Hz. d) Example OT data of single nucleotide RNAP steps from Abbondanzieri, et al. (Abbondanzieri et al., 2005) for comparison. Note, OT data in pink is filtered at 20 Hz (50 ms window) and the black is filtered at 1.33 Hz (750 ms window), while the black trace in the nanopore data is median filtered at 200 Hz (5 ms window). Figure originally appeared in (A. H. Laszlo et al., 2016).
