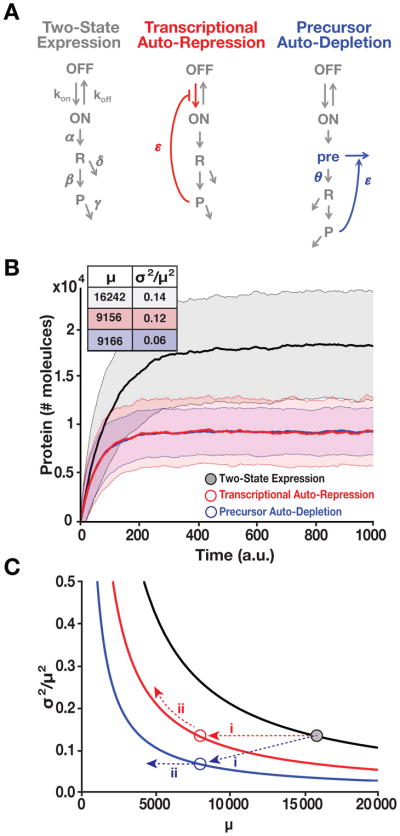
Figure 2. RNA Precursor-Depletion Feedback Could Overcome Architectural Constraints on Noise Suppression, Mitigating the Selection-Stability Tradeoff. See also Figure S1 and Supplementary Methods S1.
(A) Schematics of simplified gene-circuit models used for comparing effects of negative feedback on noise suppression.
(B) Outputs of Gillespie simulations for each model. Mean ± one standard deviation (shaded) shown for each model. Transcriptional auto-repression and precursor auto-depletion are matched in feedback strength (i.e., loop transmission) such that both generate an ~2-fold reduction in mean expression compared to the two-state model and such that response-time (i.e., rise time) is approximately the same for both. Precursor-depletion feedback exhibits significantly less noise than transcriptional auto-repression for this parameter set. Inset: mean protein levels (μ) and noise magnitude (σ2/μ2) for each model.
(C) Analytical calculations of noise (Eqs. [1–2]) showing how precursor depletion (blue) surpasses the noise-suppression capabilities of transcriptional auto-repression (red). T is the same for both transcriptional auto-repression and precursor auto-depletion and T=0 for the two-state model with no feedback (black). Solid lines were calculated from Eqs. [1–2] in the form . The numerical simulation results from panel B are superimposed on the analytical results as colored circles and can be explained using Eq. [1–2] (for detailed explanation see Supplementary Methods S1).

