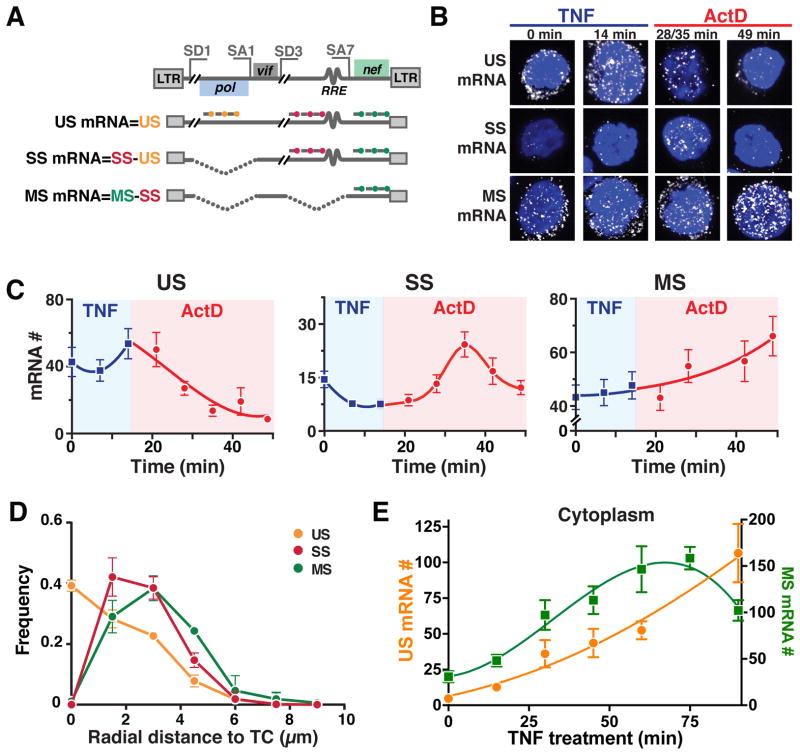
Figure 3. Post-Transcriptional Splicing in HIV Enables RNA Precursor-Depletion Feedback. See also Figure S2 and Table S1.
(A) Schematic of smFISH probes used to quantify US, SS and MS mRNAs shown relative to the HIV genome with representative splice donor (SD) and splice acceptor (SA) sites and representative US, SS, and MS HIV genes.
(B) Representative smFISH images of transcriptional pulse-chase in HIV-infected Jurkat cells (cells are polyclonal for HIV-integration sites). TNF activation of the HIV promoter was chased 14 minutes later with the transcriptional elongation inhibitor Actinomycin D (ActD).
(C) Quantification of mRNA molecules during the TNF pulse (blue) and the ActD chase (red).
(D) smFISH spatial distributions of HIV mRNAs within the nucleus. Radial-distance distributions for each RNA species from the TC in that cell shows that US RNA is maximal at TC and decays with distance from TC while MS and SS RNAs are absent at TC and peak 1.5–3 μm from TC, respectively, corresponding to post-transcriptional splicing.
(E) Nuclear RNA kinetics after TNF activation as measured by smFISH. MS RNA exhibits a negative-feedback overshoot while US RNA continually increases. (C–E) Each data point represents the mean mRNA count for ~100 cells; error bars represent SEM.

