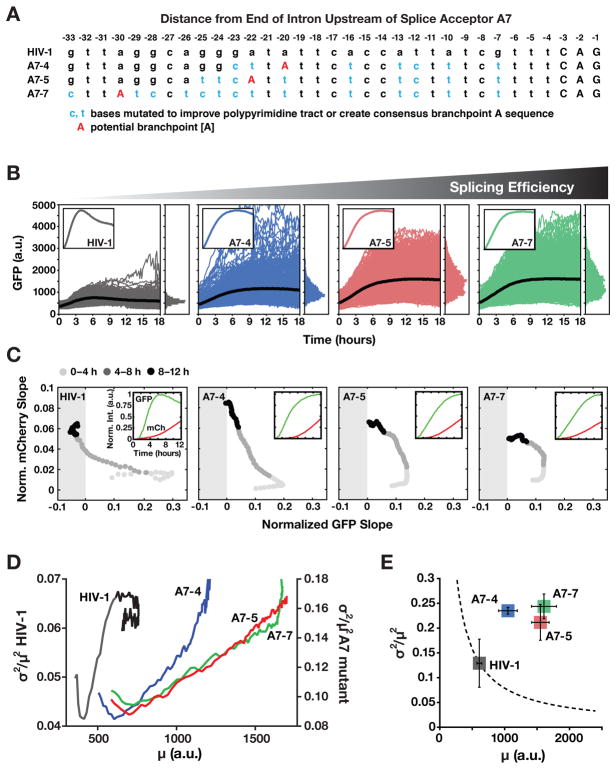
Figure 6. Inefficient Splicing Enables HIV’s Precursor-Depletion Feedback Circuit to Surpass Apparent Noise-Suppression Constraints. See also Figure S6 and Table S3.
(A) Schematic of HIV A7 splice-acceptor site sequence together with sequence mutations cloned to correct A7 to a more consensus splice acceptor and enhance splicing.
(B) Time-lapse microscopy of wild-type HIV d2G (n=592) and three SA7 mutants (A7–4 n=665, A7–5 n=774, A7–7 n=788) with enhanced splicing (populations are polyclonal for viral integration sites). Insets: mean trajectories normalized to max (to examine overshoot).
(C) Decoupling between MS and US expression in the SA7 mutants. The two-color reporter assay shows that, in the SA7 mutants, US expression rate (i.e., mCherry slope) increases without the wild-type-like decrease in MS expression rate (i.e., d2GFP slope) and MS expression rate does not enter the negative (i.e., negative feedback) regime. Slopes are normalized to max for comparison purposes. Insets: mean intensity trajectories for GFP and mCherry.
(D) Dynamic CV2 versus mean for data in panel B (0–12 h) showing that wild-type HIV (left y axis) decreases in mean and CV2 coincident with negative feedback being initiated whereas mutants (right y axis) exhibit monotonic increase in CV2 and mean.
(E) Steady-state CV2 versus mean for data in panel B (12–18 h) plus two additional repeats (Errors bars represent standard deviation). Mutants exhibit a large increase in CV2 compared to wild-type HIV despite increased mean expression. The dotted line is the Poisson-model prediction.

