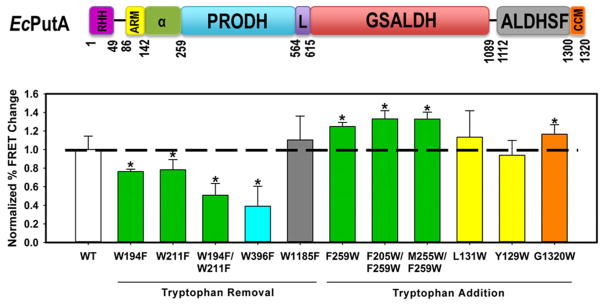
Figure 8.
FRET mapping of EcPutA membrane interactions. Wild-type EcPutA and mutants (1 μM) were incubated with inverted E. coli polar vesicles (with 5% dansyl-PE incorporated) (0.025 mg/mL) in 10 mM HEPES buffer (150 mM NaCl, 2 mM MgCl2, pH 7.5) and treated with and without 10 mM proline. Fluorescence emission was monitored at λem = 520 nm using a λex = 290 nm. (Top panel) The coloring of the EcPutA domain map matches the colors of the FRET data (bottom panel). FRET data are plotted as the relative change in fluorescence emission as a function of proline with the mutants normalized to wild-type EcPutA. Data are the mean ± SD from four independent experiments (*, p < 0.05).

