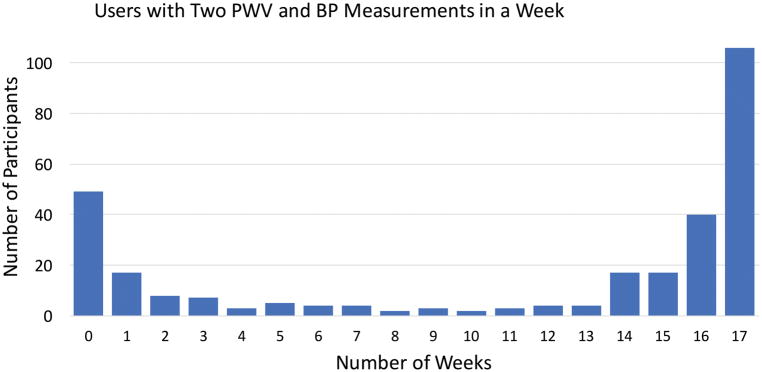
Figure 2. Histogram Plot of Adherence Data.
Represented is a histogram of the number of participants that successfully measured blood pressure and pulse wave velocity, less than 1 hour apart according to number of weeks in the study. For example, 49 individuals signed up for the study online, but never recorded a measurement. This is represented by the 1st column, or 0 number of weeks.

