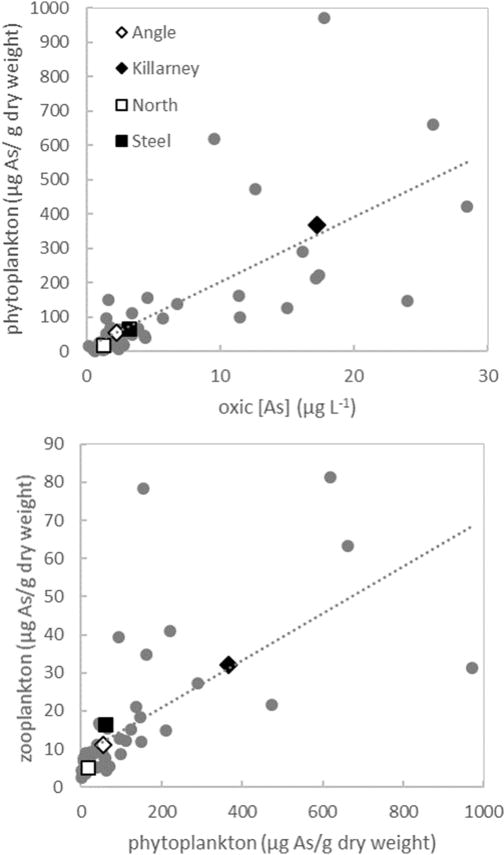
Fig. 5.
Relationship between average total arsenic concentrations in the oxic portion of the water column (>1 mg O2 L−1) and total arsenic in phytoplankton samples (top). Relationship between total arsenic in phytoplankton samples and total arsenic in zooplankton samples, excluding outlier described in Table 3 (bottom). Colored diamond symbols indicate seasonal averages for each lake in both plots. Grey circles represent each sampling date (n=47) during summer months (May–Oct) with the dashed lines showing the least-squares linear regression in each panel for all sampling dates.

