
Fig. 8.
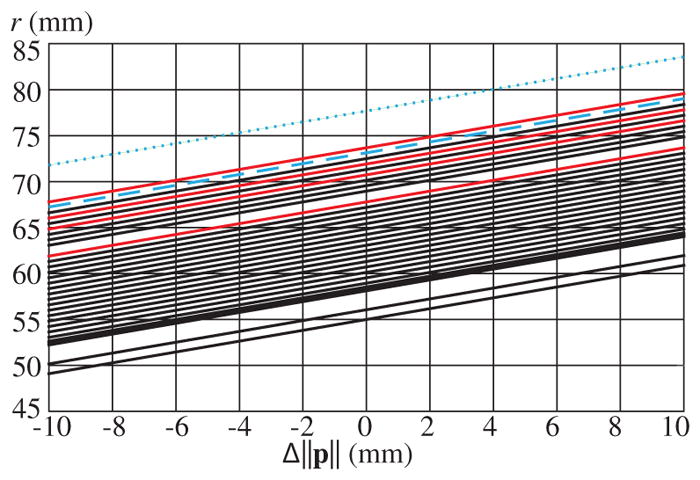
r as a function of Δ||p|| for all subjects analyzed. C1 and C2 results are shown in red, with all others shown in black. The blue-dashed and blue-dotted lines indicate two and three standard deviations above the mean, respectively.
Official websites use .gov
A
.gov website belongs to an official
government organization in the United States.
Secure .gov websites use HTTPS
A lock (
) or https:// means you've safely
connected to the .gov website. Share sensitive
information only on official, secure websites.
r as a function of Δ||p|| for all subjects analyzed. C1 and C2 results are shown in red, with all others shown in black. The blue-dashed and blue-dotted lines indicate two and three standard deviations above the mean, respectively.