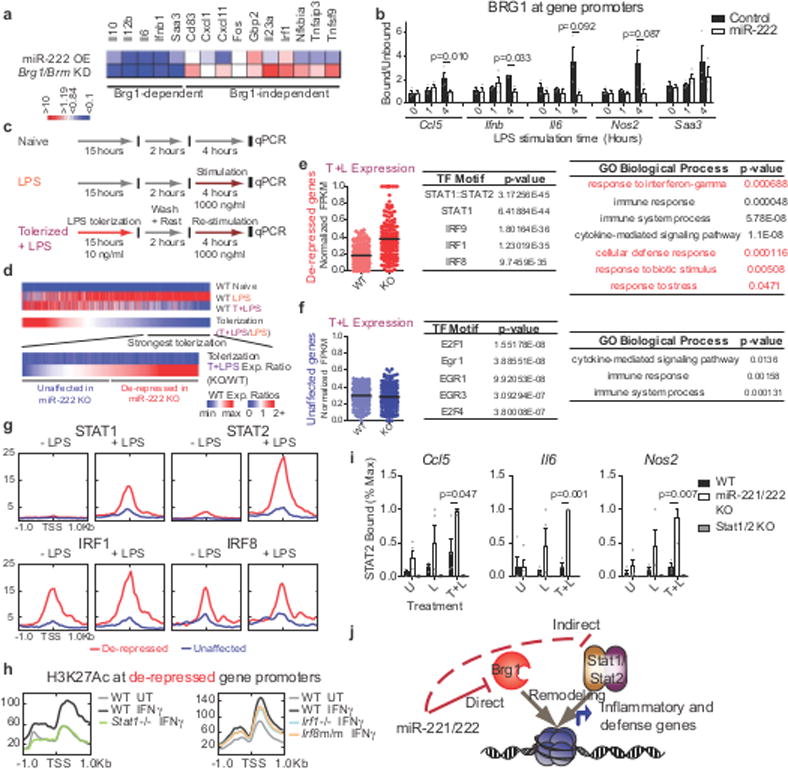
Figure 2. miR-222 suppresses BRG1- and STAT-dependent inflammatory gene expression.

a, Comparison of miR-222 mimic transfection and Brg1/Brm knockdown15 effect on LPS-induced gene expression. b, ChIP in iBMDMs transduced with overexpression constructs (n=3 independent experiments; p-values from Students t-test for paired values, 2-sided). c-d, Schematic of treatments (c) and genes (d) analyzed in (e-i). e-f, Dotplot of RNA-seq expression values (normalized to maximal expression per gene), top 5 predicted41 transcription factor motifs, and statistically over-represented gene ontology terms (determined by PANTHER) for indicated gene groups (n=103 gene expression values/group). g-h, Transcription factor occupancy (g) and histone modification (h) at promoters, quantified from published ChIP-seq datasets. i, ChIP for STAT2 occupancy in peritoneal macrophages. Values normalized to maximal binding detected for each ChIP (WT, miR-221/222 KO n=4 biologically independent samples; Stat1/2 KO n=2 biologically independent samples. p-values only calculated for WT vs. miR-221/222 KO comparisons by Students t-test, 2-sided, heteroscedastic). j, Model of miR-221/222 effect on chromatin at affected gene promoters. For all bar graphs and dot plots, center represents mean and error bars (if present) the SEM.
