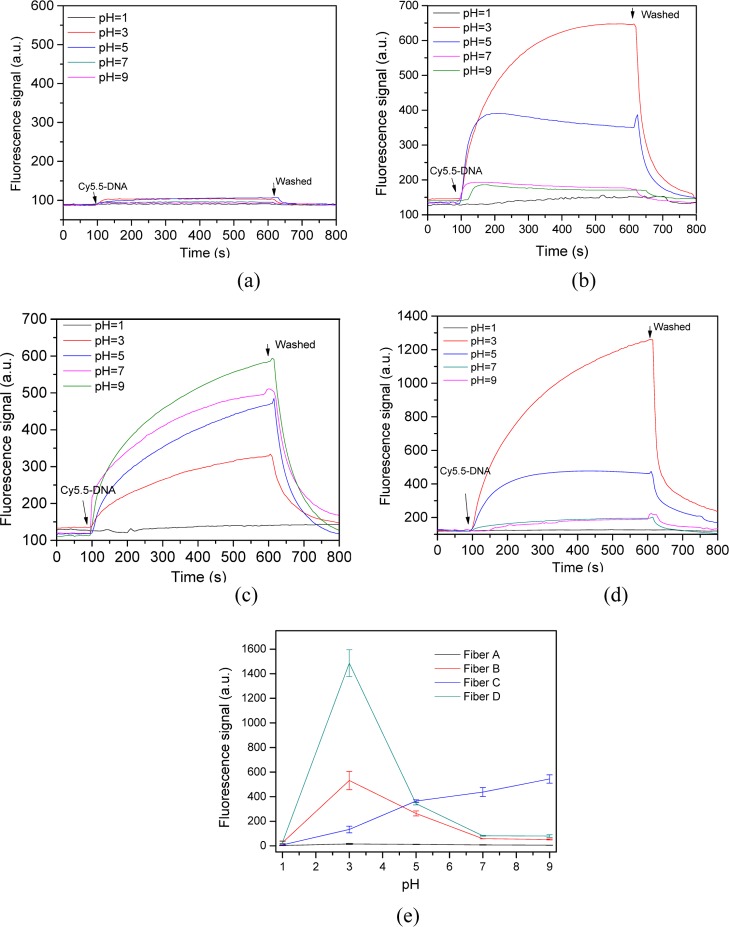
Figure 4.
Kinetics of ssDNA adsorption onto functional optic fiber probes under different pH values. (a) Fiber A; (b) fiber B with hydroxyl groups; (c) fiber C with amino groups; (d) fiber D with OVA protein; and (e) fluorescence signal of different functional optic fiber probes at equilibrium adsorption, in which the ssDNA concentration was 20 nM. The error bars represent standard deviation from three measurements.

