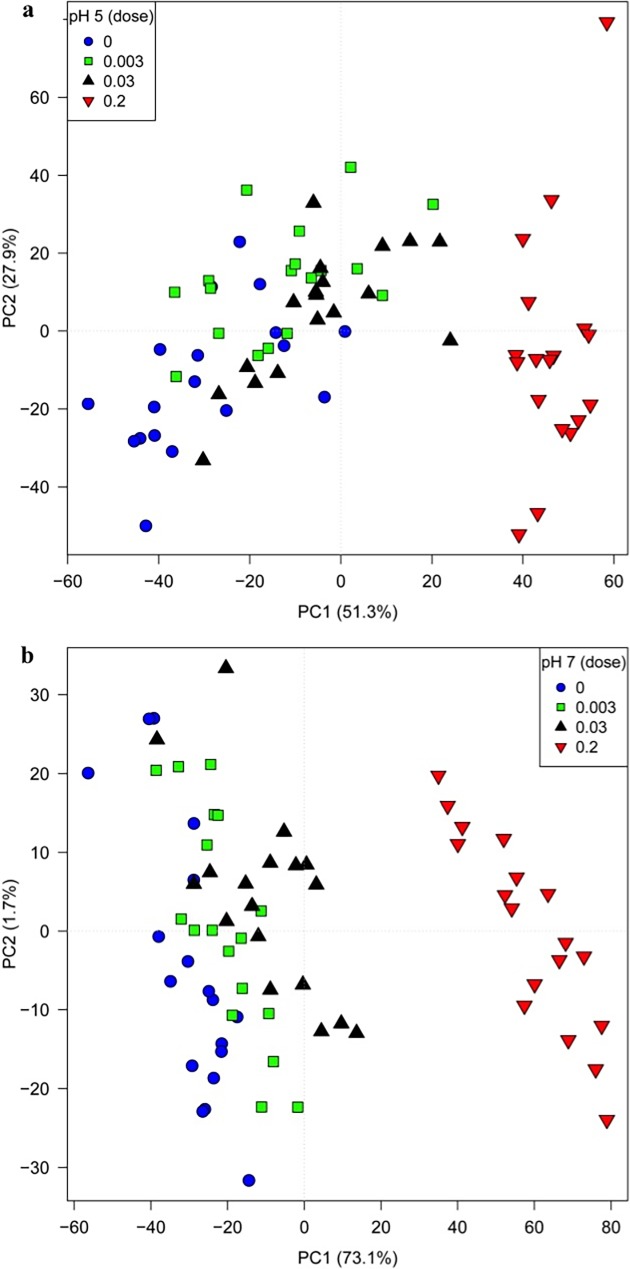
Fig 5. Multi-block PCA score plots from FT-IR spectra.
The plot shows the relationship between the effect of different concentrations of trimethoprim (0, 0.003, 0.03, 0.2 mg L-1) and that of different pH levels. Block scores plots showing the distribution of samples with different concentrations at (a) pH 5 and (b) pH 7.

