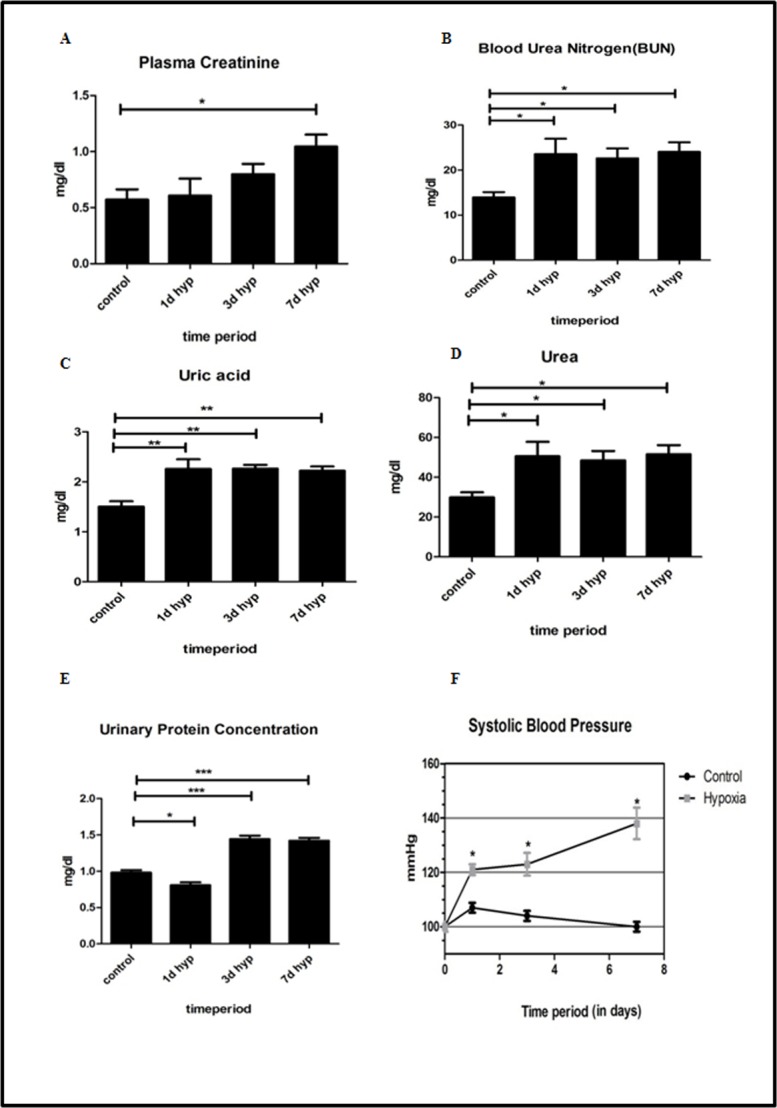
Fig 2. Effect of hypobaric hypoxia on kidney function.

Biochemical and hemodynamic parameters estimated in control (normoxia) and experimental groups (different intervals of hypobaric hypoxia exposure) (n = 5). (A) Plasma Creatinine. (B) Blood urea nitrogen (BUN). (C) Uric acid. (D) Urea. (E) Urinary Protein concentration. (F) Systolic blood pressure. Data represented here is Mean ± S. E. M. Values are significant if P< 0.05. *stands for level of significance when P<0.05, **when P<0.05, *** when P<0.05 vs. control.
