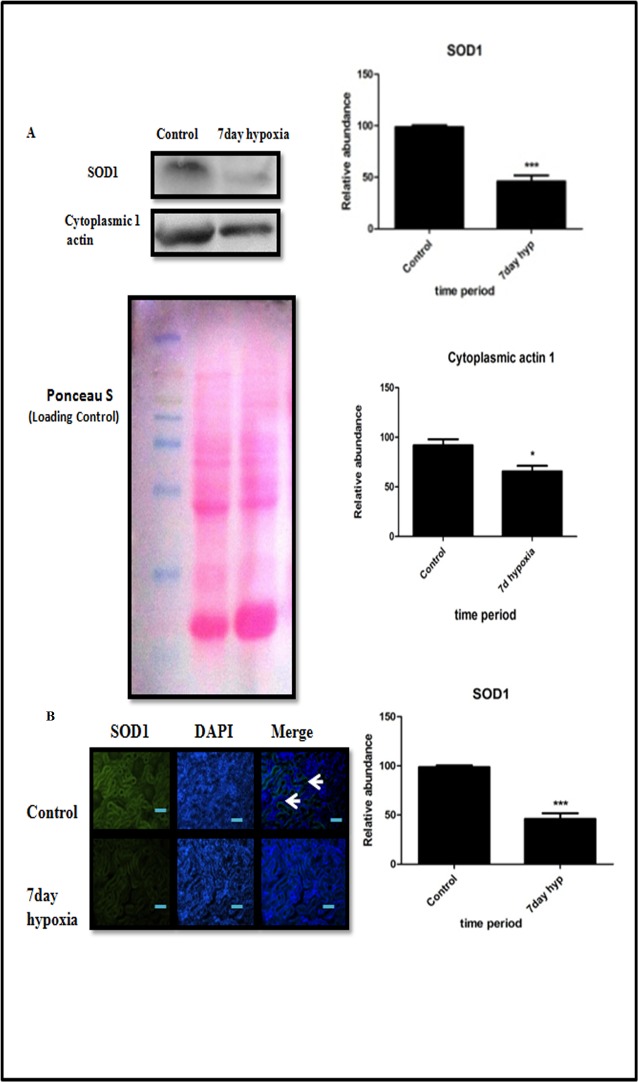
Fig 9. Validation of proteomic data by Immunoblottting and immunofluorescence.
(A) Western blot analysis of SOD1 and cytoplasmic 1 actin of control and 7 day hypoxia group. Kidney tissue and their respective optical densities (ROD) and densitometry analysis of results from western Blot indicating significant change between two groups compared by Student ‘s t-test (B) Immunofluorescence analysis of SOD1 in control and 7 day hypoxia exposure group. Results have been represented in term of %. Values are significant if P<0.05. * stands for level of significance when P<0.05, **when P<0.05, *** when P<0.05 vs. control.

