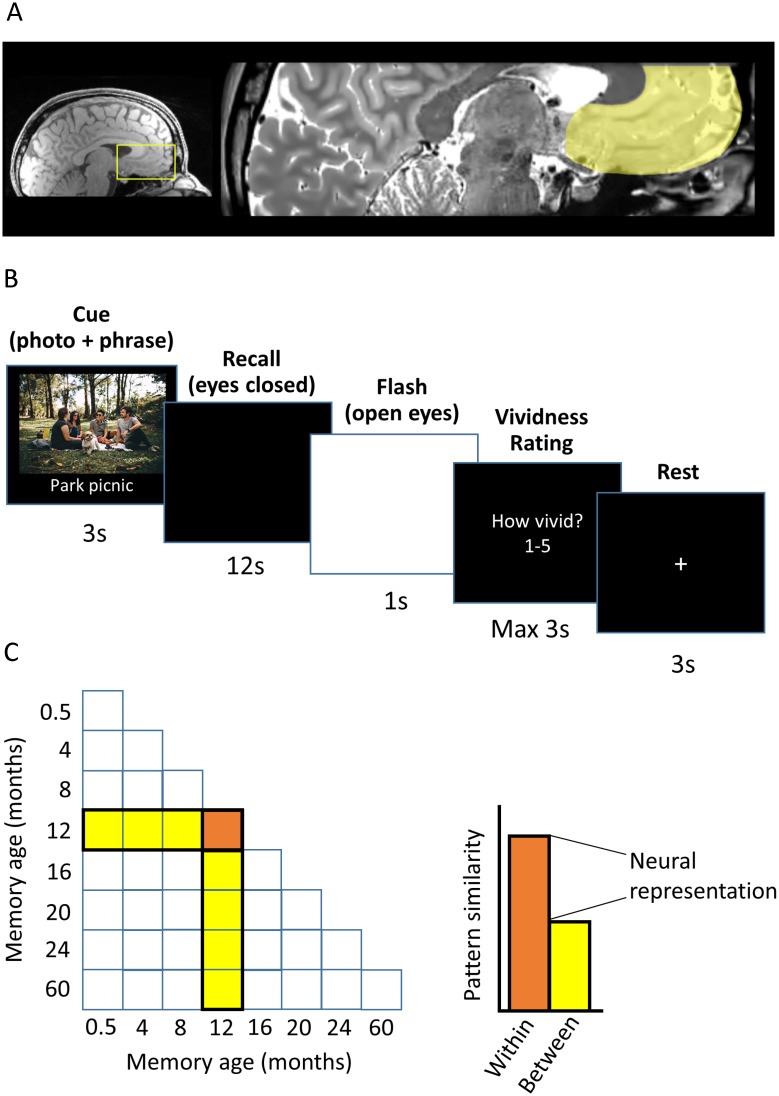
Fig 3. Experimental details.
(A) The vmPFC is highlighted on an example participant’s structural MRI scan. (B) The timeline of an example trial from the scanning task. (C) Graphical illustration of the neural representation score calculation using RSA. The neural pattern similarity across trials recalling the same memory (orange) minus the mean pattern similarity between that memory and other memories (yellow) generates a ‘neural representation’ score. A score significantly higher than 0 indicates a neural pattern distinct to that memory is present in the vmPFC. RSA, representational similarity analysis; vmPFC, ventromedial prefrontal cortex.

