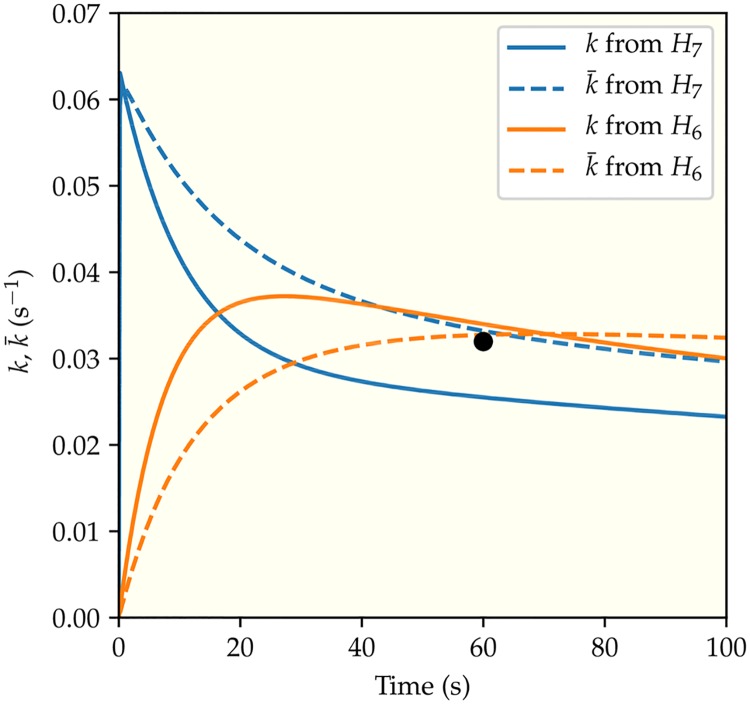
Fig 6. The predicted kinetics.
The time dependence of the apparent phosphoryl transfer rate constants for the two different dual-regulation mechanisms (H6 and H7) are represented by the two different colors (blue for regulating and (H7) and orange for regulating and (H6)). The system studied here contains the least active receptors (EEEE) in membrane vesicles with [Asp] = 10 μM, [ATP] = 104 μM, and [P1] = 400 μM, which reproduces the conditions of the rightmost point of the lower curve in Fig 4(d). The solid and the dashed lines correspond to the instantaneous (k) and the average () phosphorylation rate constants respectively. The black circle is the experimental data point from [17].

