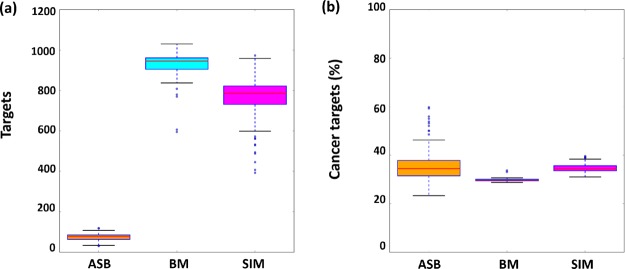
Figure 4.
Target distribution. For ASB scaffolds (orange), BM scaffolds (cyan), and similarity searching (SIM, magenta), boxplots report the distribution of (a) all targets and (b) the percentage of cancer targets for all 73 cell lines. Boxplots show the smallest value (bottom), first quartile (lower boundary of the box), median value (red line), third quartile (upper boundary of the box), largest value (top), and outliers (blue dots).

