Figure 3.

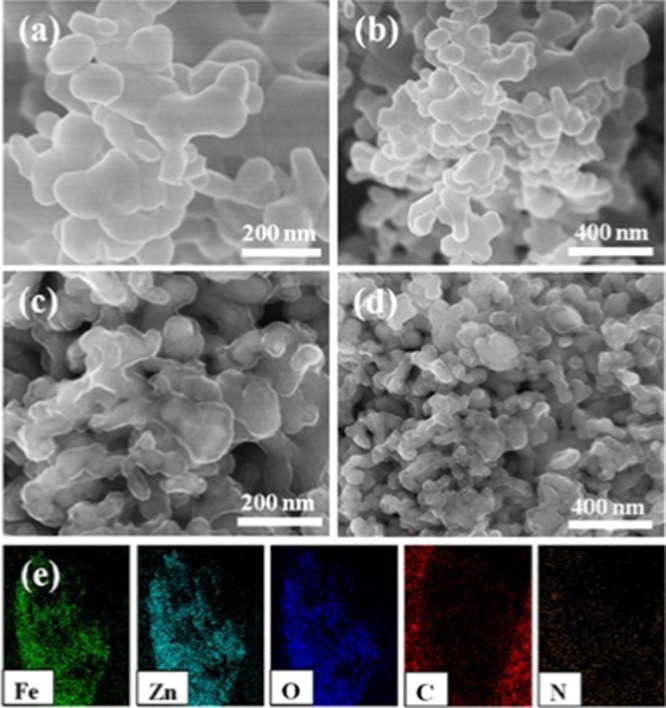
Field emission scanning electron microscope (FESEM) images of ZF800 (a, b) and ZFDA1 (c, d), and energy-dispersive X-ray spectroscopy (EDS) mapping images of ZFDA1 (e).

Field emission scanning electron microscope (FESEM) images of ZF800 (a, b) and ZFDA1 (c, d), and energy-dispersive X-ray spectroscopy (EDS) mapping images of ZFDA1 (e).