
Figure 5.
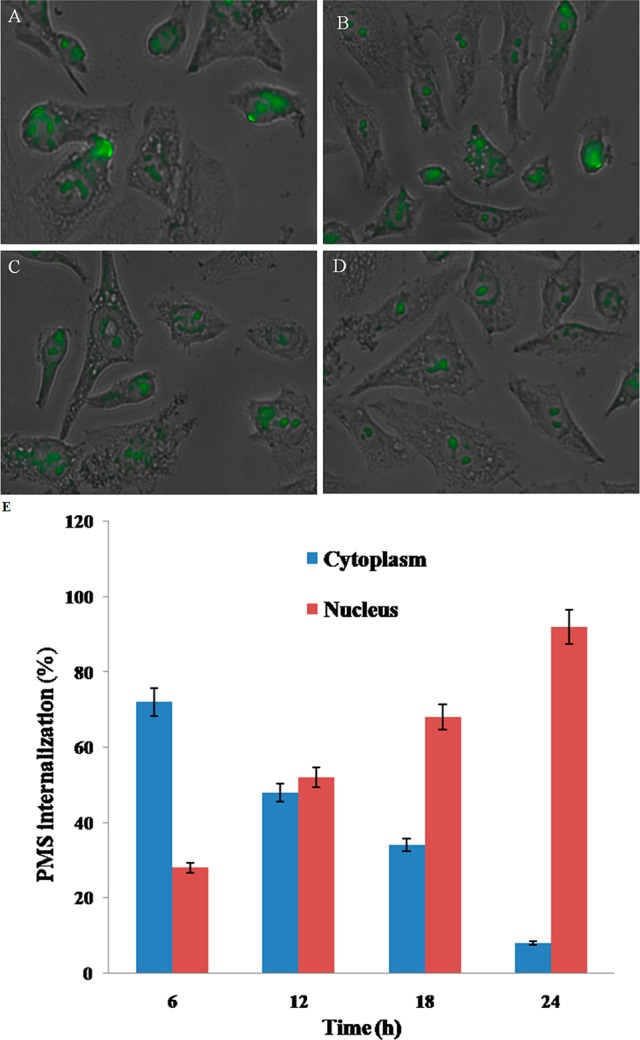
CLSM images of MDA-MB-231 breast cancer cells after treatment with PMS nanocomposites (IC50 concentration) at the different time intervals (A) 6 h, (B) 12 h, (C) 18 h, and (D) 24 h, verifying the intracellular location of FITC-labeled PMS nanocomposites. (E) Graph showing the quantitative analysis of intracellular location of the PMS nanocomposites at different time intervals.