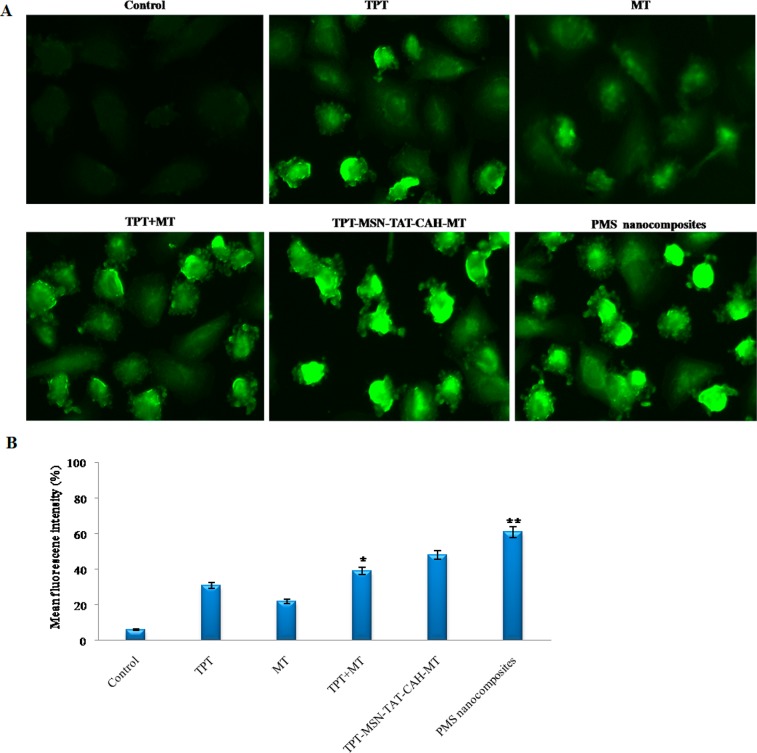
Figure 9.
(A) Fluorescence images of MDA-MB-231 cells after treatment by nanodrug formulations and stained with DCFH-DA showed the effects on ROS generation. (B) The quantitative analysis of ROS generation using a plate reader in MDA-MB-231 cells. The data stand for mean ± SD, *p ≤ 0.05 was calculated statistically significant. Scale bar 400× magnifications.

