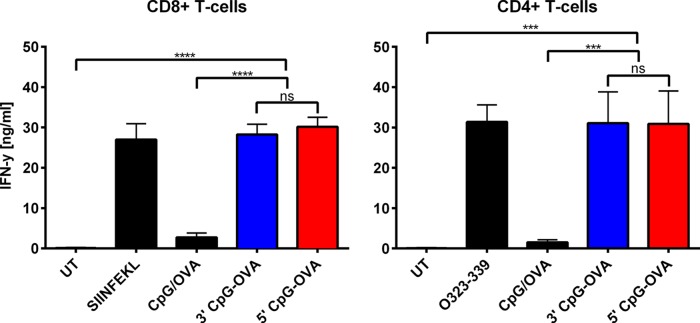
Figure 5.
IFN-γ production by conjugate-treated T-cells. BMDCs were pulsed with a mixture of CpG (0.2 μM) and OVA (79 nM), 3′ CpG–OVA conjugate (equivalent to 0.2 μM CpG and 79 nM OVA), 5′ CpG–OVA conjugate (equivalent to 0.2 μM CpG and 79 nM OVA), or a control of either SIINFEKL (2.6 μM) or OVA323-339 (1.4 μM) peptide. CD8+ or CD4+ T-cells from OT-I and OT-II mice were co-cultured with pulsed BMDCs at a ratio of 1:10. Cell-culture supernatants were analyzed for IFN-γ levels by ELISA. Bars represent the mean of three independent experiments ± SEM; statistical significance was determined by one-way ANOVA Dunnett’s post hoc test; ****p < 0.0001, ***p < 0.001, ns = nonsignificant.

