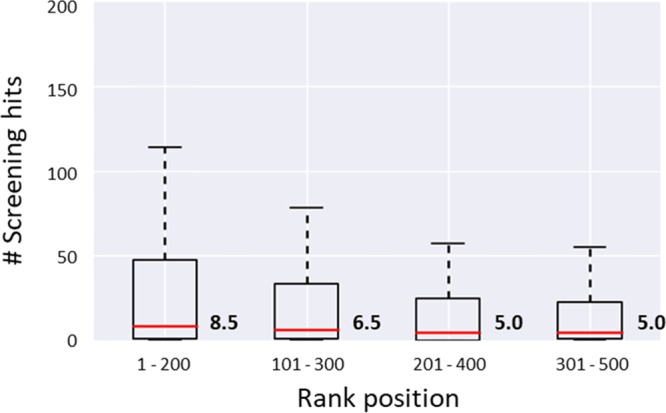
Figure 1.

Similarity search hits in subsets of compound rankings. Boxplots show the distribution of hits in overlapping subsets representing the 500 top-ranked compounds across all 66 search trials. Boxplots report the smallest value (bottom), first quartile (lower boundary of the box), median value (thick red line), third quartile (upper boundary), and largest value (top).
