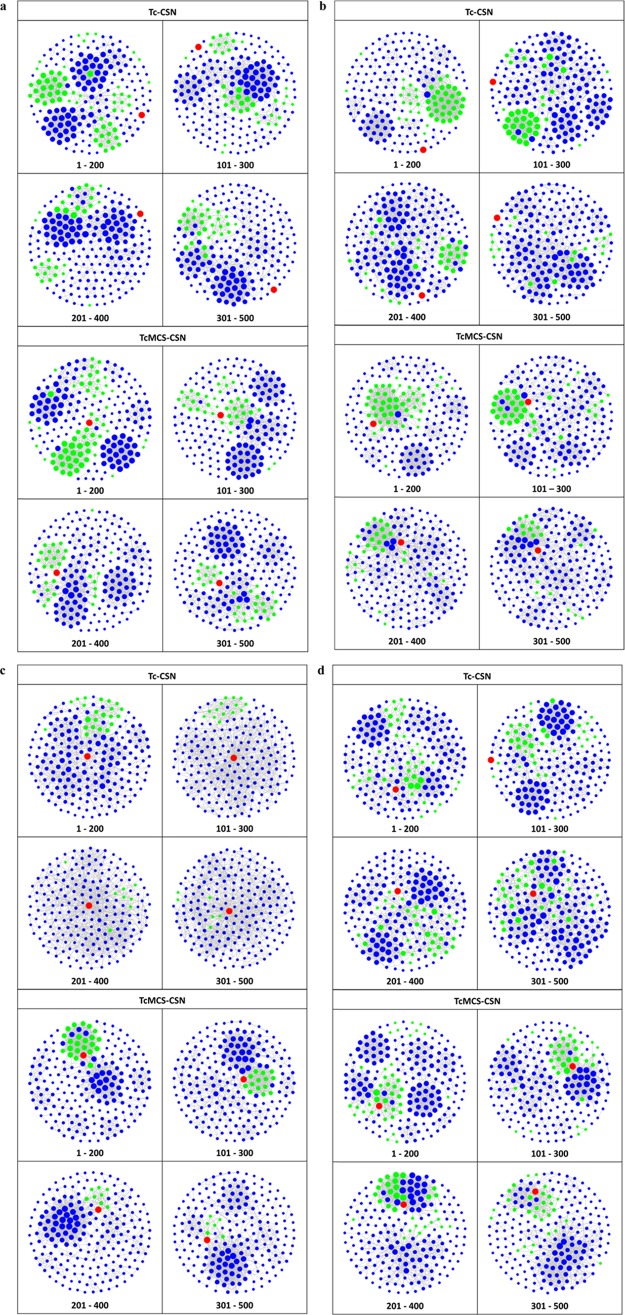
Figure 3.
Exemplary CSNs. For four exemplary similarity search sets reported in Table 1, Tc-CSNs (top) and TcMCS-CSNs (bottom) of overlapping subsets representing compound rankings are compared at a constant edge density of 5%. Nodes are color coded as follows: red, reference drug; green, hits with activity against the drug target; blue, database compounds with different activities. Drug nodes have constant size whereas nodes of hits and other database compounds are scaled in size according to their degrees. CSNs are shown for similarity searching using (a) cabozantinib, (b) iloperidone, (c) tolvaptan, and (d) sorafenib as reference drugs.

