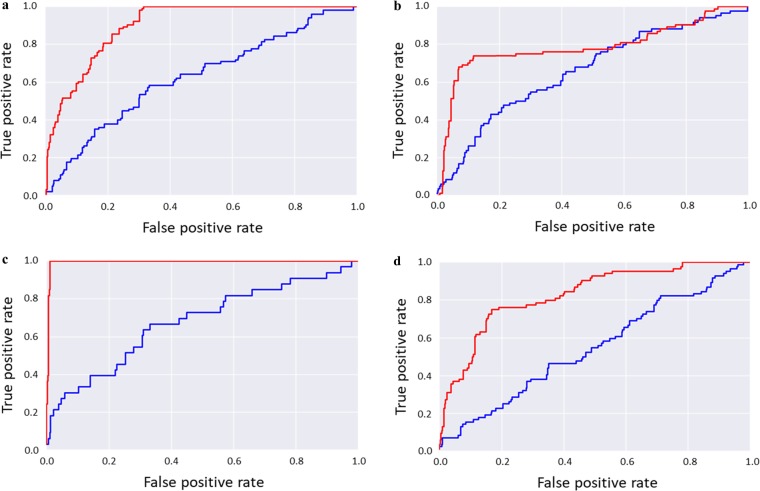
Figure 4.
Similarity search performance. Shown are receiver operating characteristic (ROC) curves for similarity search calculations using (a) cabozantinib, (b) iloperidone, (c) tolvaptan, and (d) sorafenib as reference drugs. ROC curves compare true-positive and false-positive rates over compound rankings. In each case, the ROC curves were calculated for the 500 top-ranked compounds on the basis of ECFP4 Tc values (database search, blue) and after reranking of the top 500 compounds on the basis of TcMCS calculations (red).

