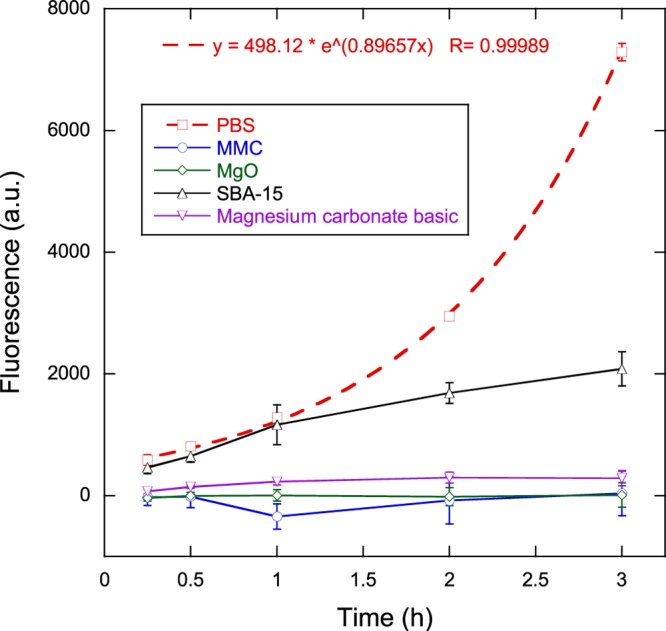
Figure 2.

Viability measurements as a function of time for bacteria in contact with MMC, magnesium oxide, mesoporous silica, and magnesium carbonate basic in comparison to the negative control PBS. Solid lines are guides to the eye, whereas the dashed line represents an exponential fit to the data for PBS. Data represent mean ± 1 sd for n = 3.
