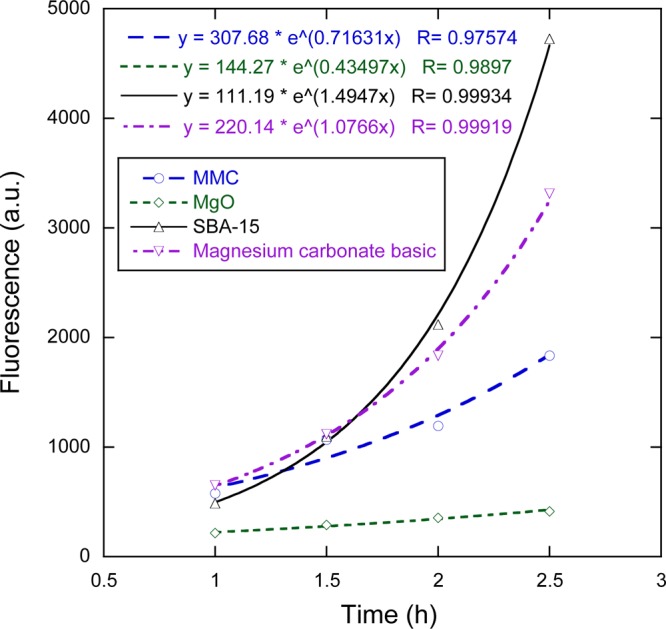
Figure 3.

Fluorescence measurements showing the growth of bacteria suspensions after separation from the powder samples at the end of the antibacterial test. The legend indicates which sample powder the bacteria had previously been in contact with. Lines represent exponential fits to the data, with corresponding equations provided in the top left corner of the plot.
