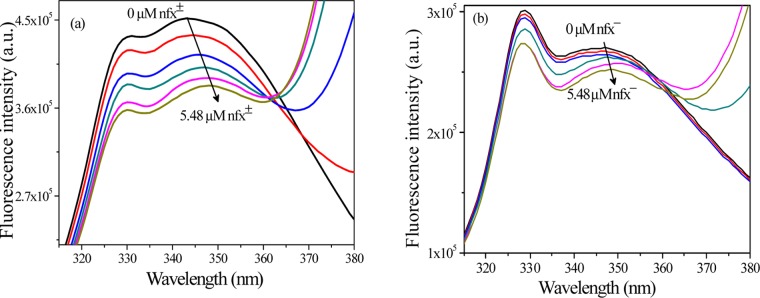
Figure 3.
Fluorescence spectra of lyz (1 μM) upon addition of (a) nfx± (at pH 7.2) and (b) nfx– (at pH 9.2) at 298 K. λexc = 295 nm. Norfloxacin concentration was varied from 0 M to 5.48 μM (in figure: 0, 1, 2, 3, 4, 5.48 μM) for both of the cases. All data are not presented in the figure for clarity.

