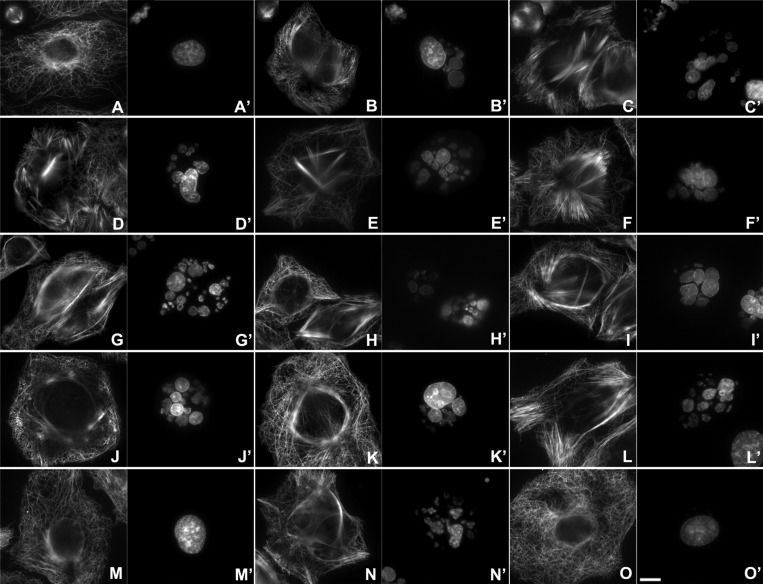
Figure 2.
Effect of the compounds on the MT network and the nuclear morphology of A549 cells. Effect of dictyostatin analogues 4, 5, 6, 8, 9, 10, and 11 and hybrid molecules 12, 13, 14, and 15 on the MT network, the mitotic spindle, and the nuclear morphology of A549 cells in comparison with untreated cells (DMSO), cells treated with paclitaxel, and the reference parent compounds dictyostatin and discodermolide. Cells were incubated for 24 h in the presence of DMSO (A, A′), paclitaxel 100 nM (B, B′), dictyostatin 50 nM (C, C′), discodermolide 100 nM (D, D′), 4 250 nM (E, E′), 5 200 nM (F, F′), 6 100 nM (G, G′), 8 200 nM (H, H′), 9 100 nM (I, I′), 10 800 nM (J, J′), 11 2 μM (K, K′), 12 60 nM (L, L′), 13 1.8 μM (M, M′), 14 6 μM (N, N′), and 15 8 μM (O, O′). MTs (A, B, C, D, E, F, G, H, I, J, K, L, M, N, and O) are labeled with the DM1A antibody against α-tubulin, whereas DNA (A′, B′, C′, D′, E′, F′, G′, H′, I′, J′, K′, L′, M′, N′, and O′) is marked with Hoechst 33342. The insets (A, A′, B, B′, C, C′, the latest representative for all ligands examined) show the mitotic spindles in the same preparations. The bar at O′ represents 10 μm, with all panels showing the same magnification.

