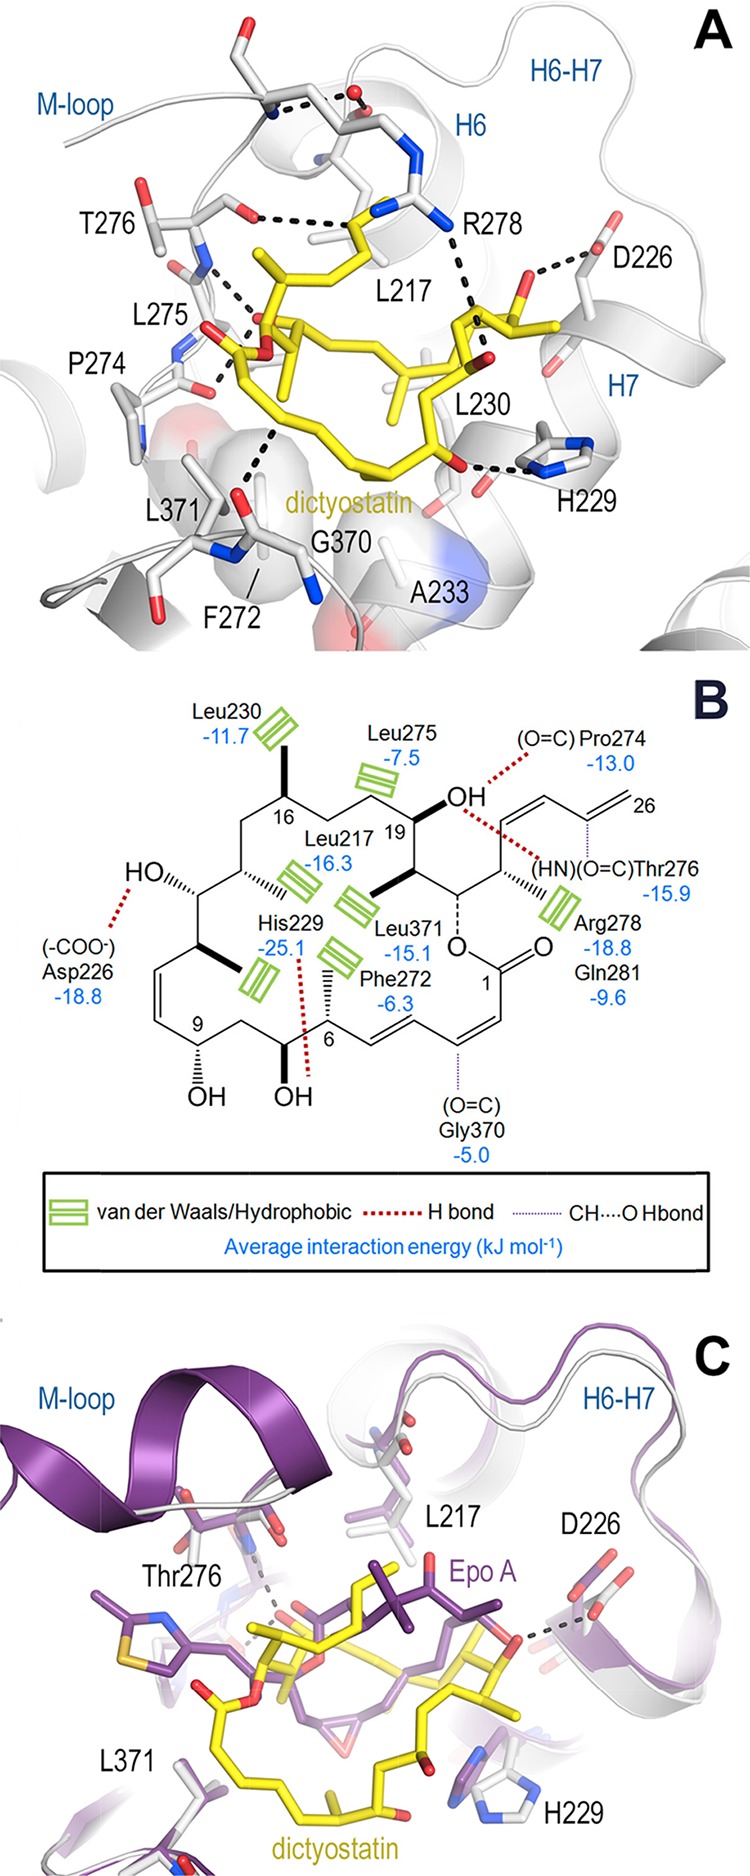
Figure 3.

Structure of the tubulin–dictyostatin complex. (A) Close-up view of the tubulin–dictyostatin complex. Dictyostatin is shown as a yellow stick representation. β-Tubulin is displayed as a light gray ribbon. Key residues forming the interaction with the ligand are shown as a stick representation and are labeled. Hydrogen bonds are highlighted as dashed black lines. (B) Schematic 2D representation of the interactions responsible for the affinity of dictyostatin for the taxane-binding site in β-tubulin. Green rectangles represent hydrophobic contacts. Standard and C=O···HC= hydrogen bonds are shown as thick and thin dotted lines, respectively. Average interaction energies (kJ mol–1), as calculated from the MD simulations,29 are given for the most important interacting β-tubulin residues. (C) Superimposition of the tubulin–dictyostatin (yellow sticks, light gray ribbon) and tubulin–epothilone A (violet-purple sticks and ribbon) structures. Hydrogen bonds of the tubulin–dictyostatin complex are highlighted as dashed black lines.
