Figure 1.

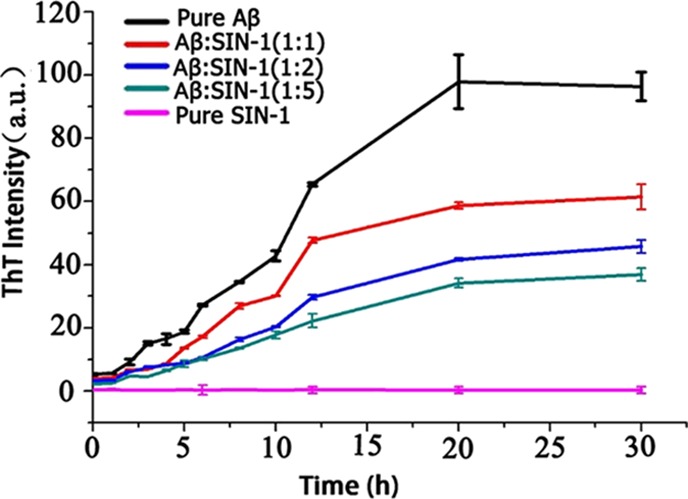
Time-dependent ThT fluorescence profiles for Aβ aggregation of 25 μM in the absence (control) and presence of SIN-1 at different molar ratios of Aβ/SIN-1 (1:1, 1:2, and 1:5). Error bars represent the average of three replicate experiments.

Time-dependent ThT fluorescence profiles for Aβ aggregation of 25 μM in the absence (control) and presence of SIN-1 at different molar ratios of Aβ/SIN-1 (1:1, 1:2, and 1:5). Error bars represent the average of three replicate experiments.