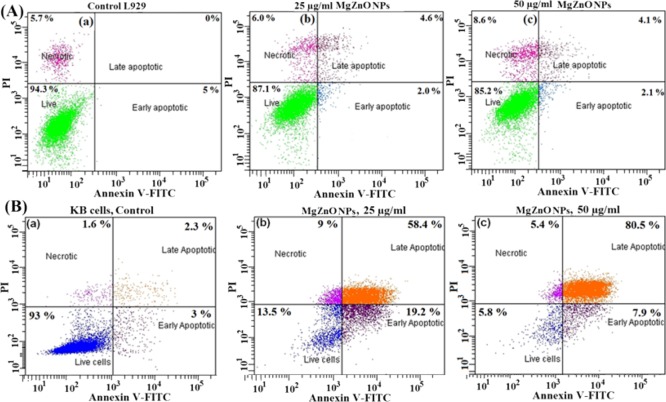
Figure 8.
(A) Flow cytogram representing apoptosis assay based on Annexin V-FITC and PI staining of cells. (a) Control and (b,c) L929 cells were treated with 25 and 50 μg/mL MgZnO NPs, respectively, for 24 h. (B) Flow cytogram representing apoptosis assay based on Annexin V-FITC and PI staining of cells: (a) control and (b,c) KB cells treated with 25 and 50 μg/mL MgZnO NPs, respectively, for 24 h.

