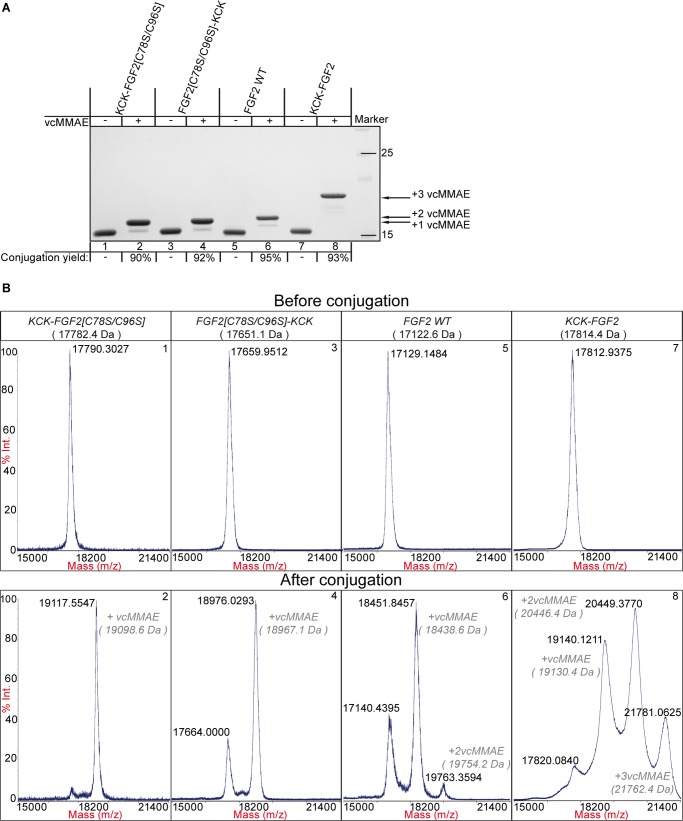
Figure 2.
Conjugation of FGF2 variants with vcMMAE. (A) Electrophoretic separation with the conjugation yield calculated from HPLC analysis showed in Figure S1. (B) Mass spectra of FGF2 variants before (upper panel) and after (lower panel) the reaction performed for 1 h at 25 °C, as detailed in Materials and Methods. Numbers of MS data correspond to the lane numbers in (A).

