
Figure 2: Quantile normalization and Loess smoothing allow comparison between samples.
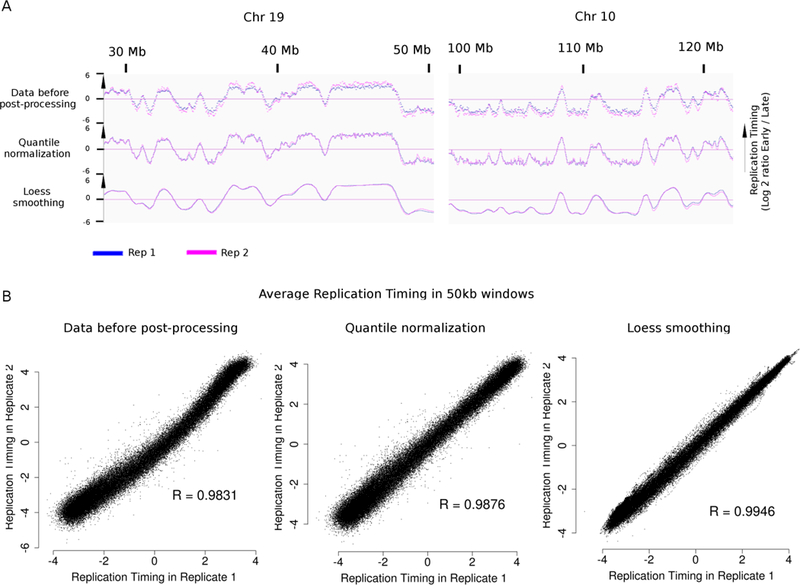
A.: Replication timing (RT) profiles of two technical repli-seq replicates (F121–9 mouse ESC, mapped on mm10) before and after each normalization step. Data are visualized using IGV. B.: Correlation between log ratio early / late at indicated step of normalization of 50kb windows along the genome of samples in A. R = Pearson correlation coefficient,