
Figure 3: Repli-chip and repli-seq give highly similar replication timing profiles at genome-wide level.
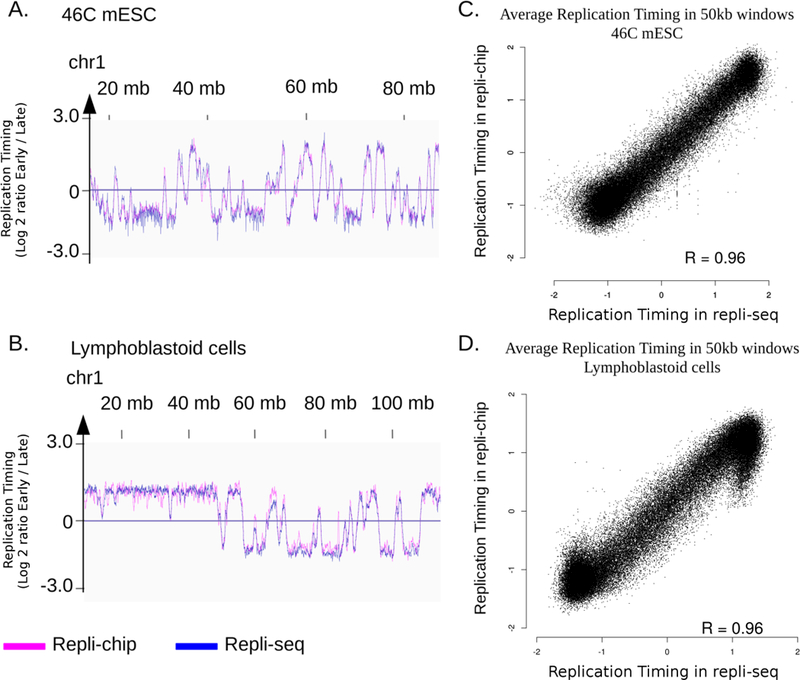
A. B.: Replication timing (RT) profile on a portion of chr1 of 46C mouse ESC (mm10) (A) and human lymphoblastoid cells (hg38) (B), visualized using IGV. RT is defined as the log2 ratio early fraction over late fraction (reads number is normalized on number of mapped reads for repli-seq). C. D.: correlation between average RT on 50kb windows on the whole genome in 46C mouse ESC (C) and human lymphoblastoid cells (D). Because repli-chip and repli-seq have different dynamic value ranges, data are scaled in R using the scale function, prior to visualisation. R = Pearson correlation coefficient.