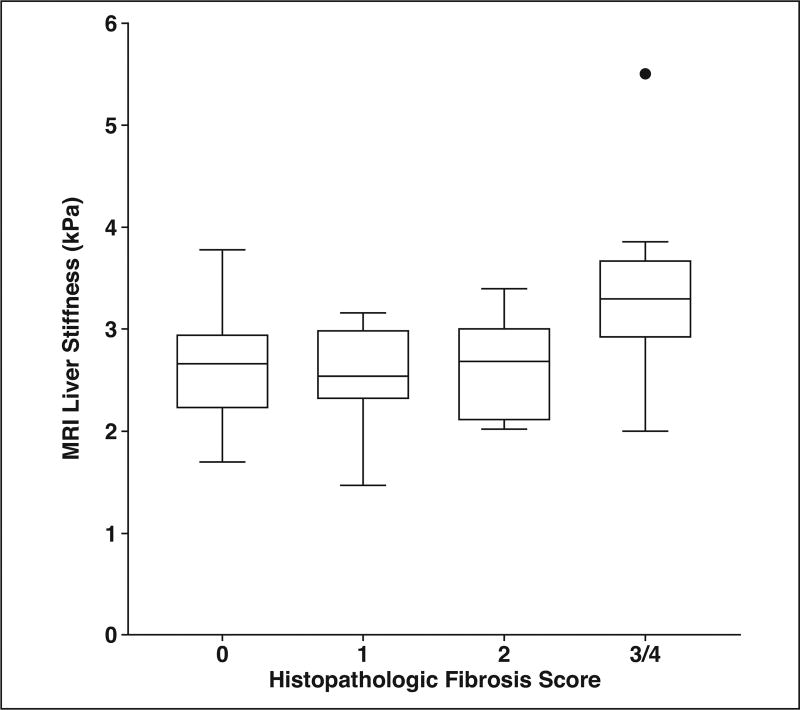
Fig. 3.
Tukey box plot of relationship between histopathologic liver fibrosis score (0–4) and liver stiffness determined by MR elastography. Circle represents statistical outlier, horizontal lines within boxes represent medians, and vertical lines and whiskers represent lowest and highest observations still within 1.5 interquartile ranges of lower and upper quartiles, respectively. Only one patient had fibrosis score of 4, and this patient reflects outlier seen in fibrosis score (3/4).

