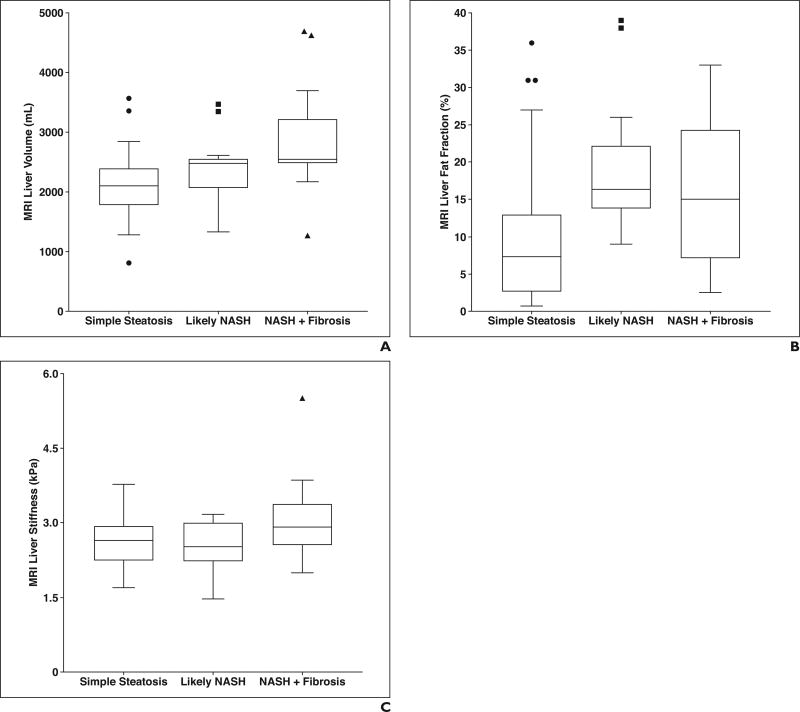
Fig. 4.
Tukey box plots showing MRI values for each categoric nonalcoholic fatty liver disease (NAFLD) histopathologic severity cohort: simple steatosis (NAFLD activity score 0–4), likely nonalcoholic steatohepatitis (NASH; NAFLD activity score 5–8), and NASH with significant fibrosis (fibrosis score ≥ 2).
A–C, Box plots show liver volume (A), fat fraction (B), and stiffness (C) for each categoric NAFLD histopathologic severity cohort. There were significant differences between cohorts for liver volume (p = 0.0005; 32 vs 18 vs 19 subjects) and liver fat fraction (p = 0.004; 26 vs 16 vs 12 subjects). There was no difference in liver stiffness between cohorts (p = 0.09; 31 vs 18 vs 19 subjects). Circles, squares, and triangles represent statistical outliers, horizontal lines within boxes represent medians, and vertical lines and whiskers represent lowest and highest observations still within 1.5 interquartile ranges of lower and upper quartiles, respectively.

