
Fig. 3. Mass spectrometry profiles of the residual gas and AP-XPS spectra of the Pt3Ni(111) surface under 40 mtorr of CO and 100 mtorr of O2 mixed gas (1:2.5 ratio) at elevated temperatures.
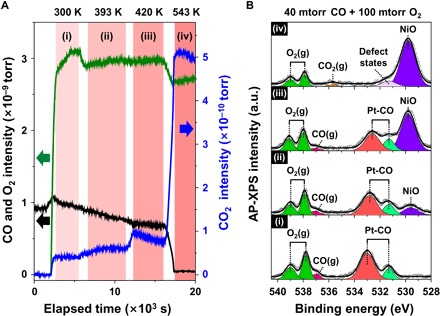
(A) Time-lapse mass fragment profiles for m/z = 28 (CO; black solid line), m/z = 32 (O2; green solid line), and m/z = 44 (CO2; blue solid line) in the second differential pumping stage of the photoelectron analyzer. (B) O 1s core-level AP-XPS spectra (hν = 650 eV) for (i) 300 K, (ii) 393 K, (iii) 420 K, and (iv) 543 K.