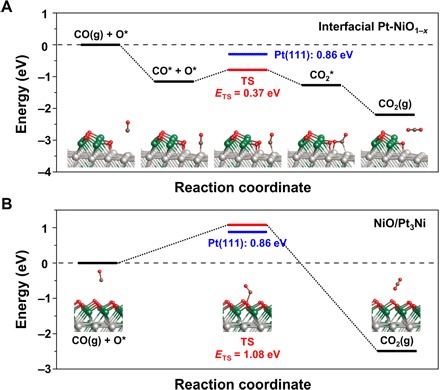
Fig. 4. DFT calculation results of the chemical reaction pathway for CO oxidation.

Energy profiles for (A) the interfacial Pt-NiO1−x and (B) the fully oxidized NiO on the stoichiometric Pt3Ni structure. The optimized minimum and transition state (TS) structures are shown, and their relative energies are summarized by the solid black and red lines, respectively. For the energy barrier (ETS) of the rate-determining step, the results for Pt(111) are also shown (blue) for comparison. The adsorbed species are denoted with asterisks (*). The colors for each atom in the model: Pt (light gray), Ni (green), O (red), and C (brown).
