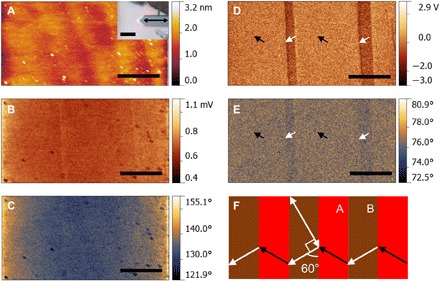
Fig. 4. PFM measurements.

(A) AFM topography image of β′-In2Se3. Inset: Optical image of the cantilever and the exfoliated crystal. The horizontal scanning direction is indicated by the black double-headed arrow. (B and C) PFM amplitude and phase of vertical signal. (D and E) PFM amplitude and phase of lateral signal. (F) Schematic of the example optical axis (white double-headed arrow) and ferroelectric polarization directions (white/black arrows) of the domains. Scale bars, 5 and 30 μm (inset).
