
Fig. 2. ESR spectra for a single P donor and a 2P molecule.
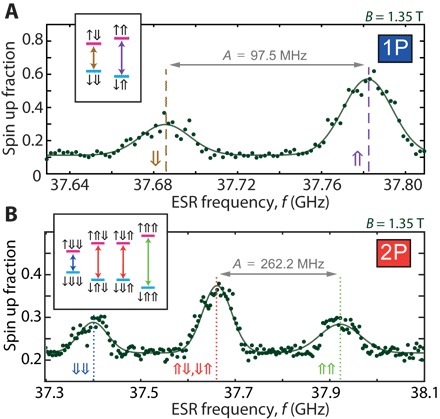
(A) Measured ESR spectrum for the 1P bound electron and (B) 2P donor molecule at B0 = 1.35 T using a ±20 MHz adiabatic passage frequency chirp. Insets indicate the nuclear (double arrow) and electron (single arrow) spin eigenstates and the ESR transitions between them, each corresponding to an observed resonance peak. The measured hyperfine energies A1P and A2P are indicated for each donor quantum dot.