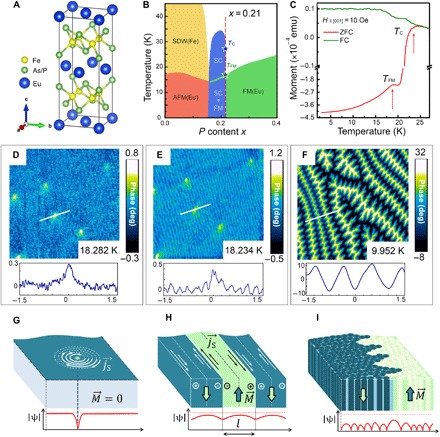
Fig. 1. Coexistence of superconductivity and ferromagnetism in EuFe2(As0.79P0.21)2.

(A) Atomic structure of the material. (B) Phase diagram of EuFe2(As1-xPx) as a function of P/As substitution. Vertical red dashed line marks the P content x = 0.21 of the studied samples. The stars denote the FM transition temperature TFM and SC critical temperature TC, TFM < TC. (C) Zero magnetic field cooled (ZFC; red line) and 10 Oe field cooled (FC; green line) magnetization curves. The onsets of superconductivity TC and of ferromagnetism TFM are marked by red arrows. emu, electromagnetic unit. (D to F) Local magnetic MFM maps acquired at the same sample area 8 μm × 8 μm at T = 18.28 K, T = 18.23 K, and T = 9.95 K in zero magnetic field. They demonstrate, respectively, a conventional Meissner state at TFM < T < TC, striped DMS discovered in a temperature range of 17.80 K < T < 18.25 K, and a domain vortex state revealed below T = 17.2 K. (G to I) Schematic views (not to scale) of the three discovered phases in (D) to (F). White arrows in (G) depict the vortex currents; white and black arrows in (H) depict the Meissner currents inside the Meissner domains; white and black dashed lines in (H) define vertical planes at the centers of FM domains, where Meissner currents are zero. Bold arrows mark the magnetization direction. Red solid lines define spatial evolution of the SC order parameter in the three states; red dashed lines depict |ψ0(T)|—the maximum possible value of the order parameter at a given temperature (see explanations in the text).
