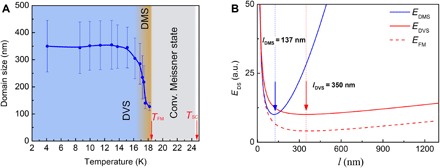
Fig. 2. Energy of the domain phases in EuFe2(As0.79P0.21)2.

(A) Temperature evolution of the domain widths extracted from MFM maps (the error bars represent the variations of the domain period over the studied sample area). Domains appear just below TFM, marking a transition from a conventional Meissner state to the DMS. Inside the DMS phase, the domain width slightly increases with lowering temperature. Around T = 17.5 K, the DMS/DVS phase transition takes place; the domain width rapidly increases. Below T = 15 K, deep in the DVS phase, the domain width is almost constant. (B) Total energy of the DMS EDMS (blue curve), of the DVS EDVS (red curve), and of the corresponding non-SC FM phase EFM (dashed curve) as a function of the domain width l at DMS/DVS transition. The calculation is done for T = 18 K and λ(T) 420 nm (see the Supplementary Materials). In the DMS phase, the minimum energy corresponds to l = 137 nm and, in the DVS phase, to l = 350 nm, in agreement with the experiment. a.u., arbitrary units.
