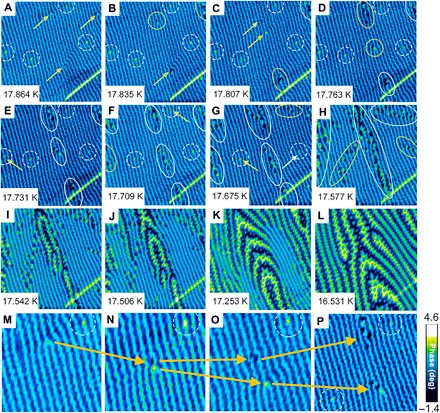
Fig. 3. Spontaneous V-AV generation and domain structure evolution at DMS/DVS transition.

(A to K) Local magnetic MFM maps acquired in a narrow temperature window ΔT ≈ 0.6 K from T = 17.86 K (A) to T = 17.25 K (K) in the same sample area 8 μm × 8 μm as in Fig. 1 (D to F). Pinned Abrikosov vortices are marked with dashed circles. Yellow arrows point to specific locations (Y-shaped dislocations of the domain structure, trapped Abrikosov vortices, newly nucleated V-AV pairs, etc.) that work as nucleation sites for V-AV pairs; the latter are surrounded by yellow circles in the following maps (see explanation in the main text). Already existing and growing V-AV clusters are marked by white ellipses. In (I) to (K), DMS and DVS coexist. (L) A map acquired at 16.53 K already resembles the low-temperature DVS of Fig. 1F. (M to O) Zoomed images on the upper region of the maps (A) to (C), showing single V-AV pair nucleation at a Y dislocation. (P) Once created, vortex and antivortex separate and serve as secondary nucleation centers for other V-AV pairs. The contrast in (M) to (P) was optimized for better visibility.
