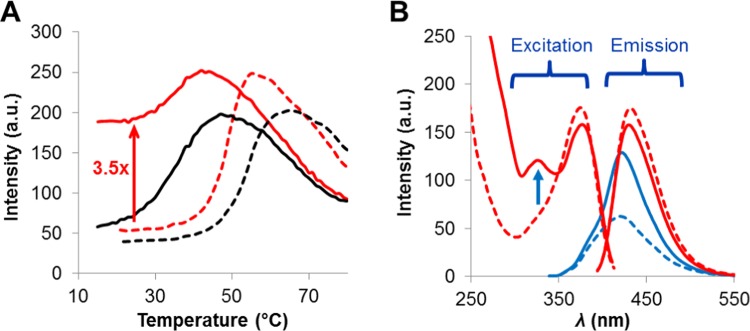
Figure 6.
(A) Emission response of the ThdG probe (411 nm), with λex = 290 nm, following heating (dashed lines) and cooling (sold lines) ThdG-11 mOTAA-12-mer duplex (3 μM) in the presence (1.2 equiv, red traces) and absence (black traces) of OTA. (B) Fluorescence spectra of the sample containing OTA prior (dashed lines) and after (solid lines) the thermal experiment. Red traces represent changes in the excitation and emission of OTA, whereas blue traces represent changes in the emission of the ThdG probe.

