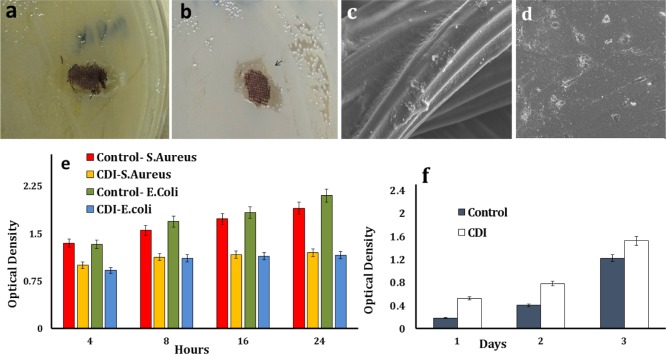
Figure 7.
(a,b) Asymmetrical zone of inhibition (black arrow) seen in E. coli and S. aureus Petri plates. SEM images of 3T3 fibroblast cells growing on (c) CDI samples (scale bar = 40 μm) and (d) control (scale bar = 10 μm). (e) Optical densities of S. aureus and E. coli cultures with the iodinated collagen-based samples over 24 h of incubation and (f) optical densities of 3T3 fibroblast cells on the CDI sample compared with the CP sample on MTT assay.

