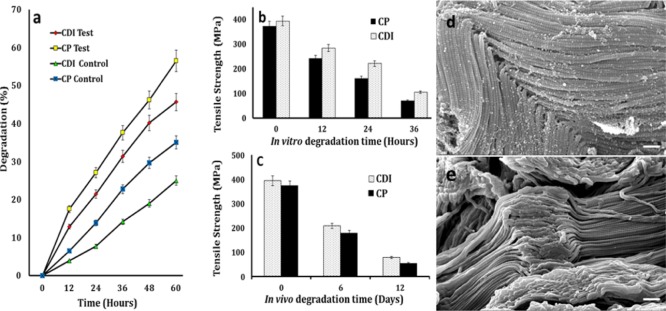
Figure 8.
(a) Percentage of weight loss for CDI and CP samples in the collagenase IIa enzyme over 60 h. The control represents the samples in PBS; (b,c) in vitro and in vivo tensile strength reduction for the CDI and CP suture samples over 12 days; and (d,e) SEM images depicting the degradation of the CDI and CP samples in the collagenase IIa enzyme (scale bar = 1 μm).

