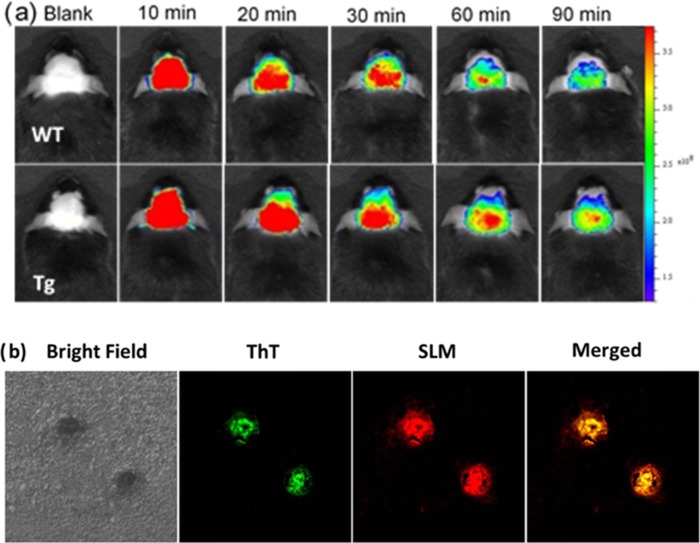
Figure 2.
(a) Fluorescence images of Tg (9 months old) and wild-type mice at different time points before and after intravenous injection of SLM (5 mg/kg). λex = 535 nm, λem = 600–640 nm. (b) Histological staining of the brain slices from 9-month transgenic mice stained with SLM via tail-vein injection (λex = 488 nm, λem = 640–680 nm) and co-stained with ThT (λex = 405 nm, λem = 460–490 nm). The images are 40× magnification of the selected regions.

