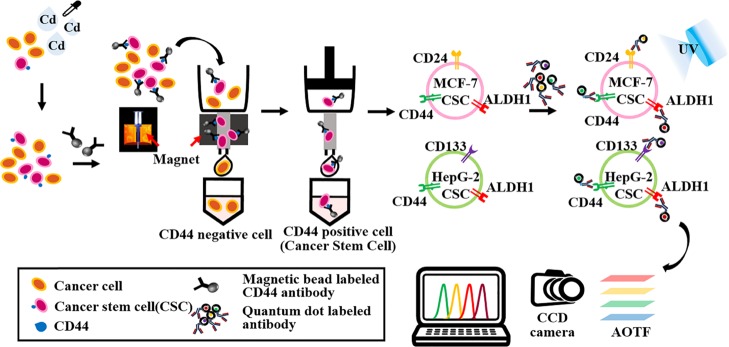
Figure 1.
Schematic illustration of the monitoring of cadmium-induced CSCs based on the concurrent identification of multiple CSC markers using QD and AOTF-based cellular imaging. MCF-7 and HepG2 cells were treated with cadmium for 72 h, followed by the separation of CSCs using a magnetic sorter. Then, hepatic CSCs were identified based on the expression of QD-conjugated CD133, CD44, and ALDH1, and breast CSCs were identified based on the expression of CD44, CD24, and ALDH1. The AOTF scans the cellular images at a single wavelength emitted from the QD-based nanoprobes without spectral overlap.

