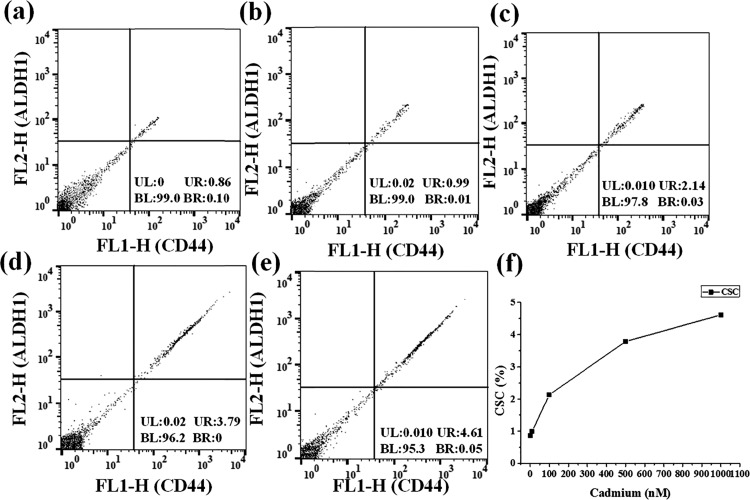
Figure 5.
(a–e) FACS analysis for the breast CSC population induced by cadmium in the MCF-7 cell culture. The x-axis represents CD44 emission, and the y-axis represents ALDH1 emission. For the x-axis, the right side indicates CD44 positive; for the y-axis, the upper side indicates ALDH1 positive. (f) Quantitative determination of breast CSCs obtained using flow cytometry.

