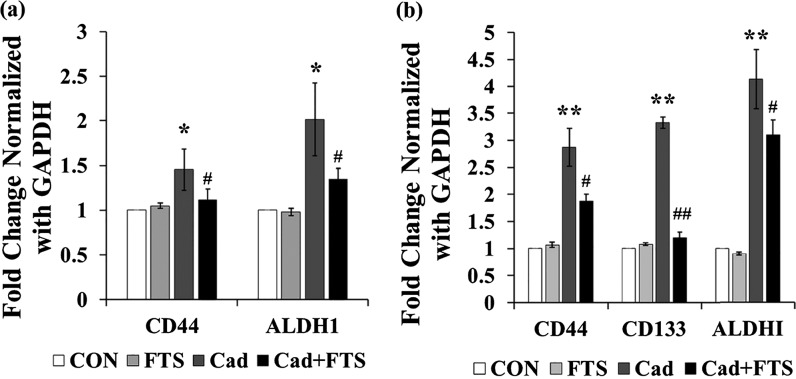
Figure 8.
Gene expression of CSC markers in HepG2 cells and MCF-7 cells treated with 25 μM Ras inhibitor and 1 μM cadmium over the period of 72 h. The mRNA expression was analyzed by RT-PCR. (a) mRNA expression of CD44 and ALDH1 in MCF-7 cells. (b) mRNA expression of CD44, CD133, and ALDH1 in HepG2 cells. Values are means ± SD from three independent experiments.

