
Figure 3.
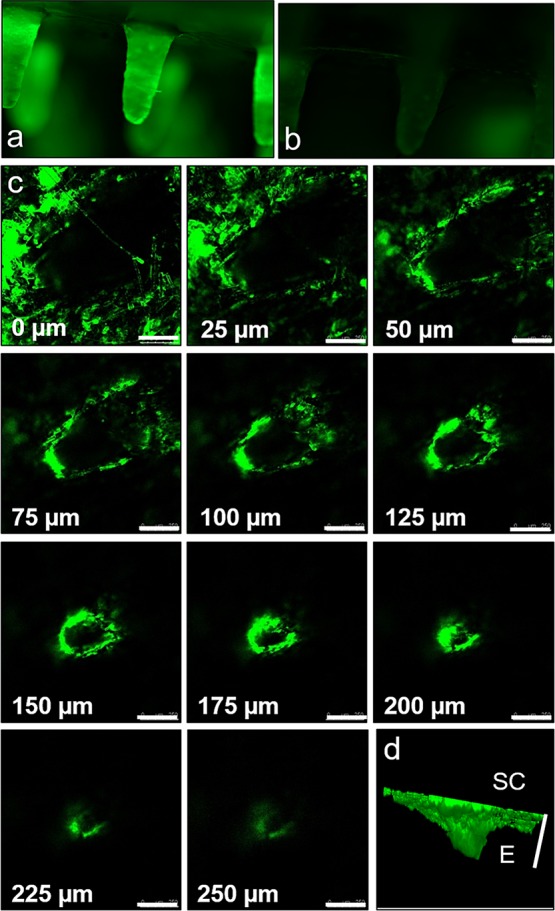
Fluorescence image of FITC–OVA-coated ZMNs before (a) and after (b) insertion into the skin for 30 min. (c) Confocal micrographs of optical sections of the skin sample from the surface (0 μm) to 250 μm inside of the skin, and 3D representation of the microchannel created due to the insertion of FITC–OVA-coated ZMNs (d). Dark areas indicate lack of fluorescence. The scale bar represents 250 μm. SC, stratum corneum and E, epidermis.